
Ice Out
2012-16
The sinking sound of melting snow is heard in all dells, and the ice dissolves apace in the ponds. —Henry David Thoreau
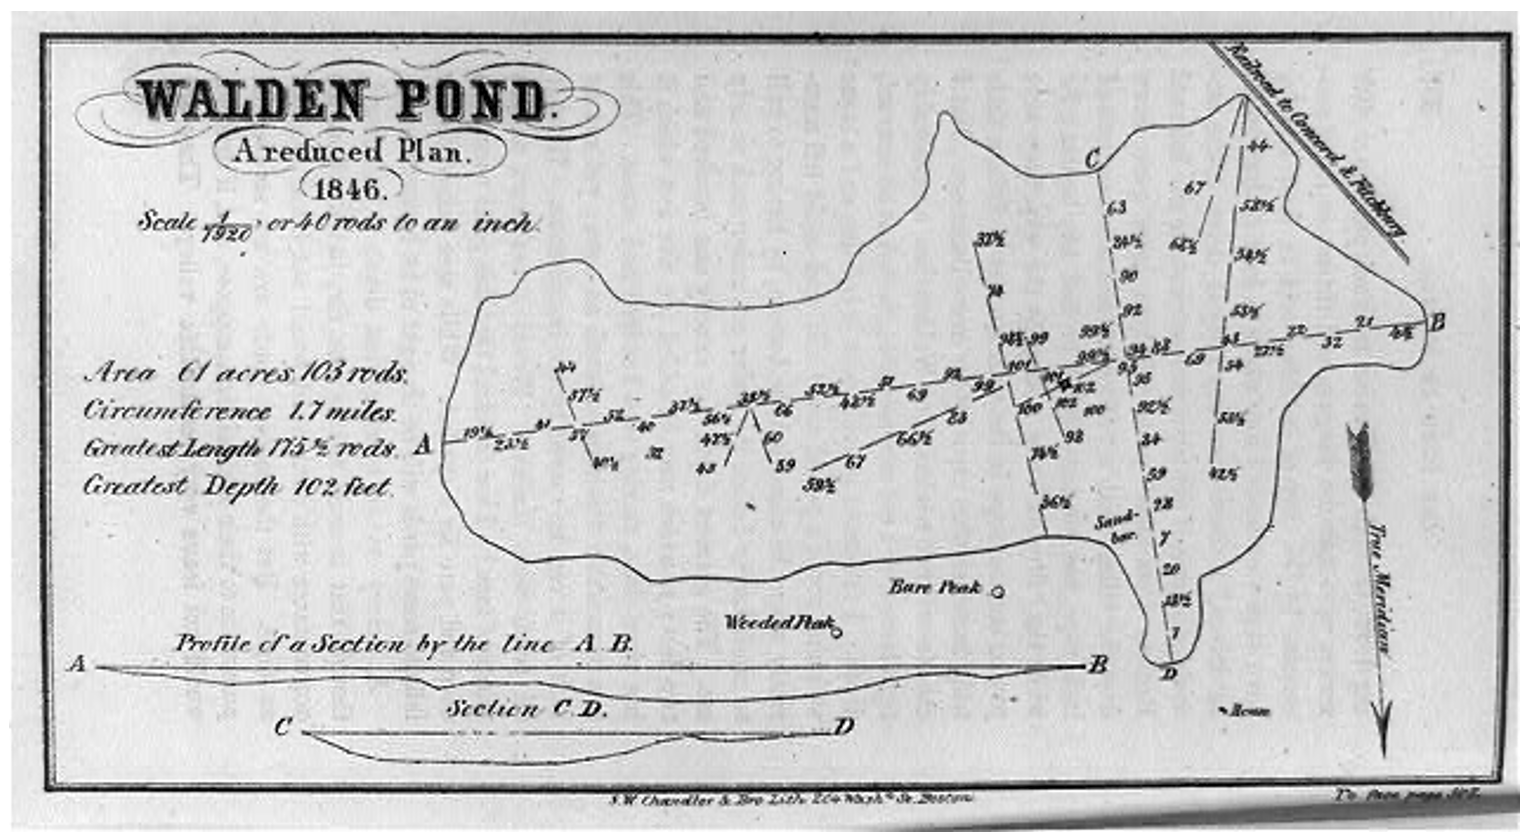
Between 1845 and 1853, Henry David Thoreau noted in his journals the day that Walden Pond’s winter ice cover had all but melted. As a naturalist and passionate scientist, Thoreau recorded minute observations of the landscape, weather, and fauna. His surveys of Walden Pond and surrounding Concord served conflicting purposes of dividing open spaces and deepening understanding of the ecology.
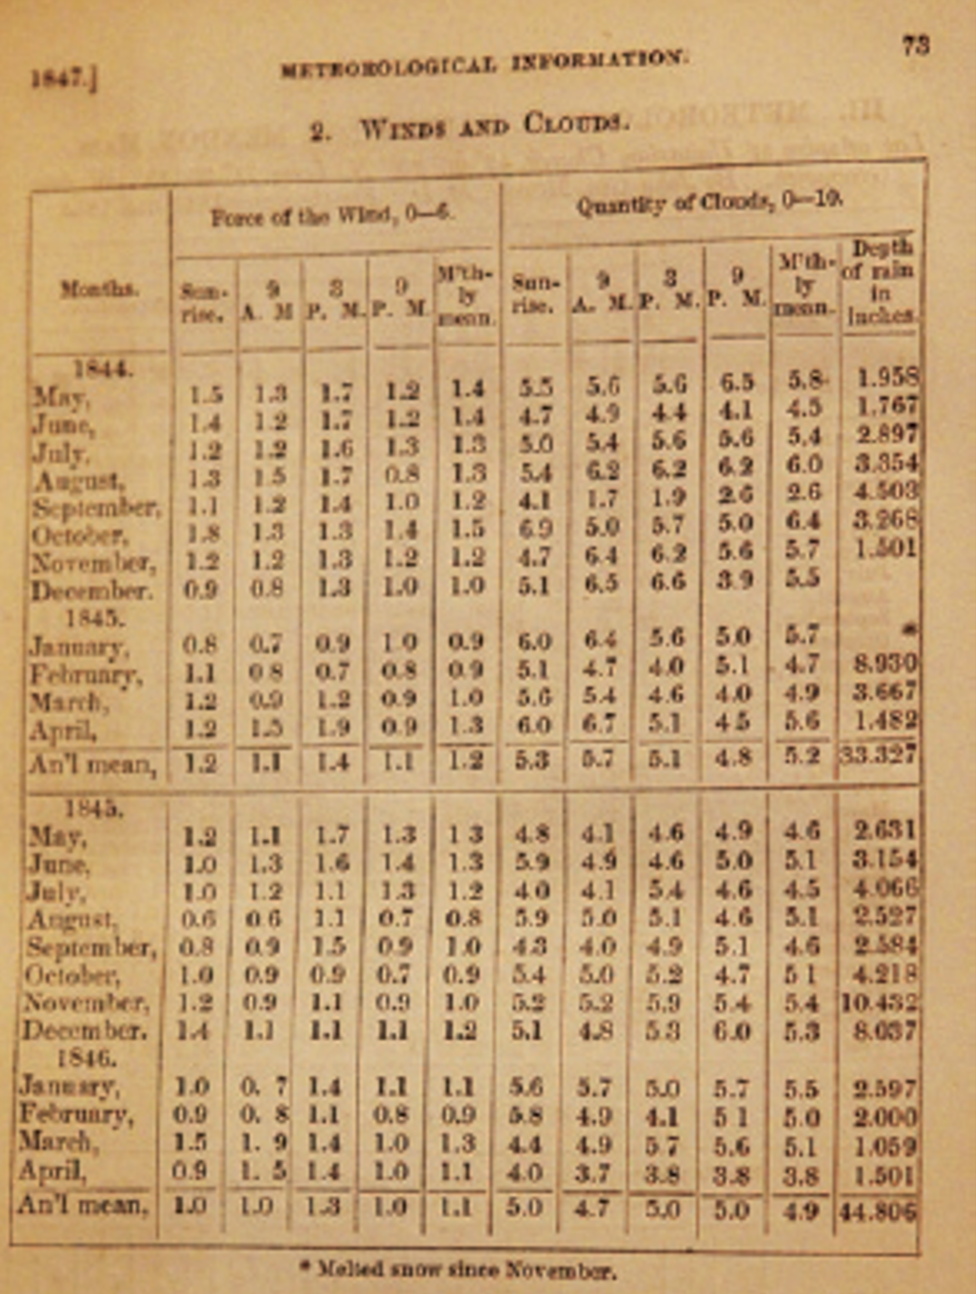
When I was deep in the midst of this project in 2012-16, the pond melted on average two weeks earlier. Ice Out is comprised of a series of works that visualize the changing climate at Walden through pairing wind data mined from Thoreau’s 1847 almanac and a local Concord weather station today. The particular days chosen are derived from Thoreau’s observations of ice out on Walden Pond throughout the 1840s and contemporary observations of ice out by scientists.
Software written in collaboration with Matthew Shanley translates wind direction and force into dance steps. Wind barbs indicating footsteps overlay marks from Thoreau’s surveys and contemporary plans for a housing development named Walden Woods.
Ice Out at Walden 1-5, 2010 15” x 25” collograph, dry point, japanese woodblock, digital print A series of monoprints pairing Thoreau's ice out observations with contemporary weather station data and wind speed and direction.
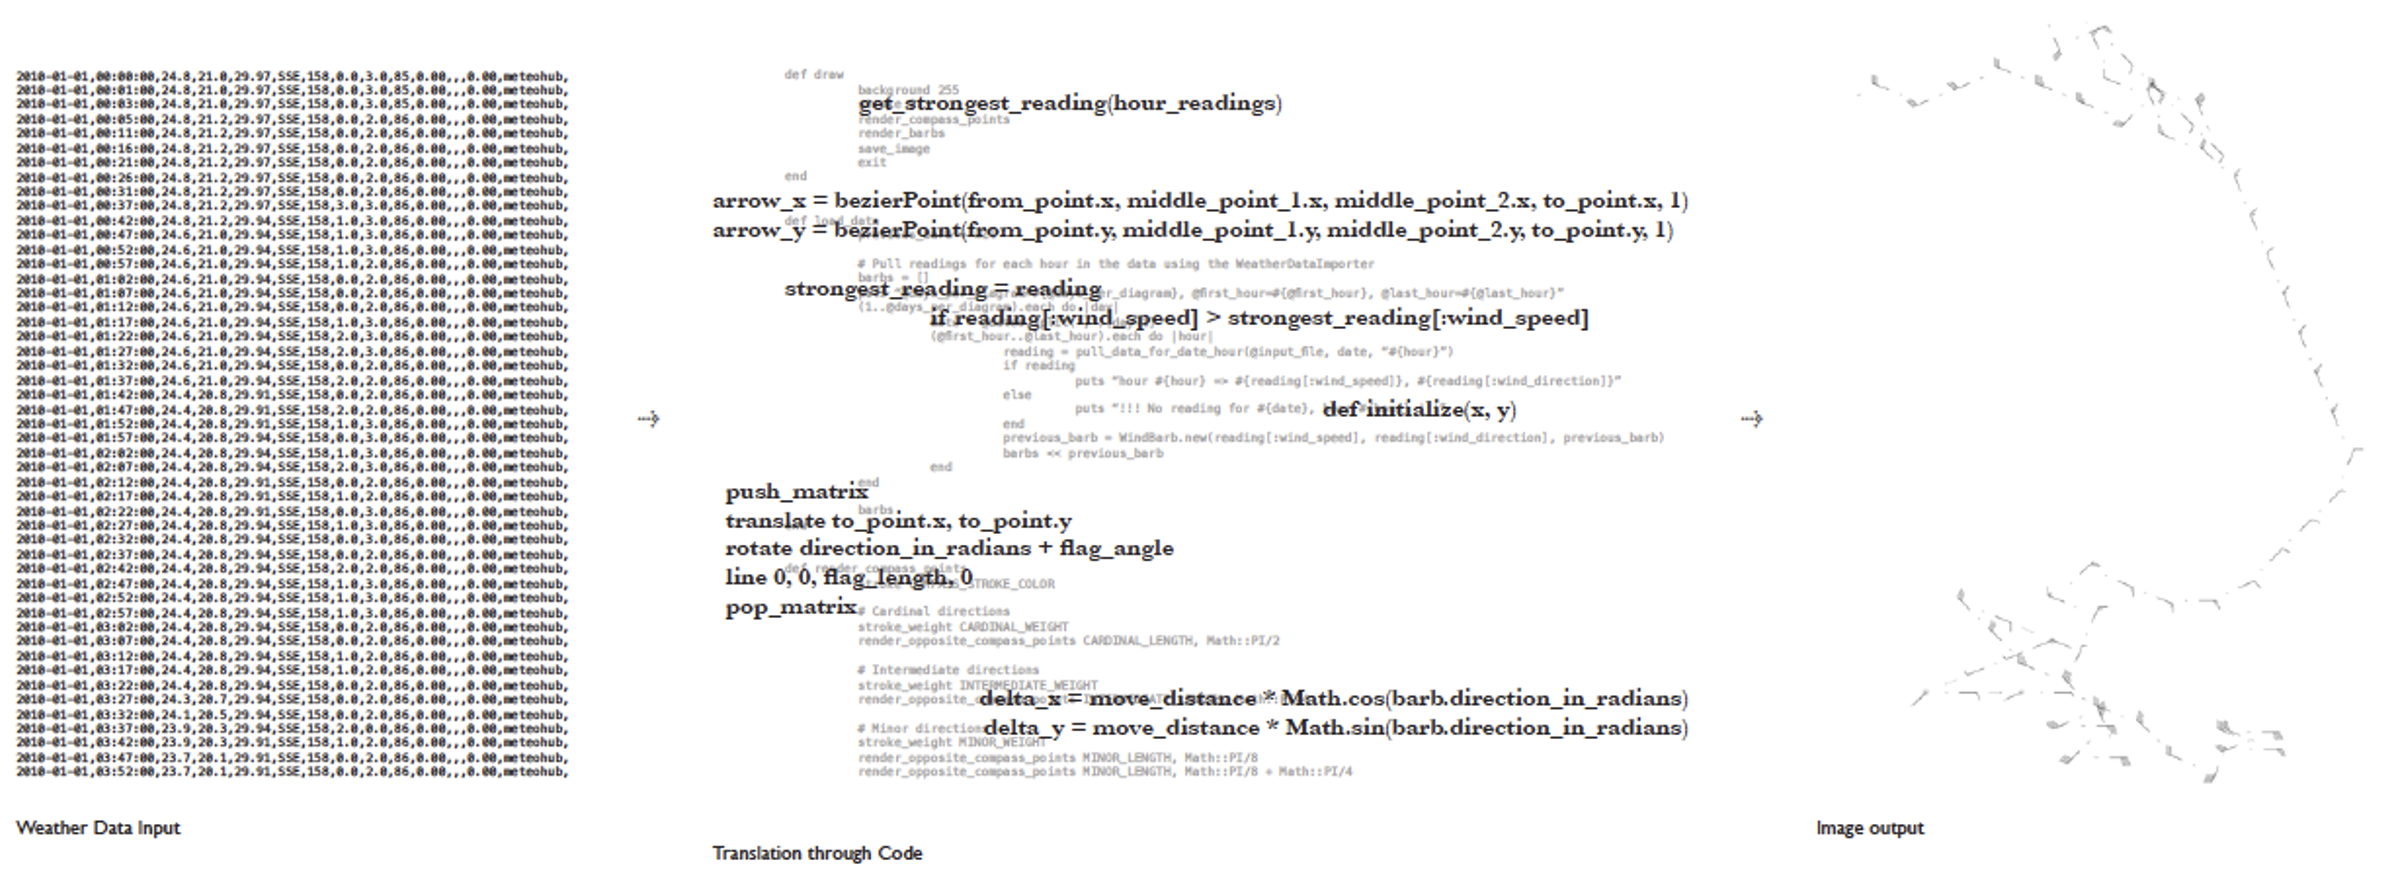
Wind Notation Code, created with Matthew Shanley, 2012 Wind Notation Code is an open source software that accepts wind speed and direction input from any Weather Underground station and translates it into notation for steps.
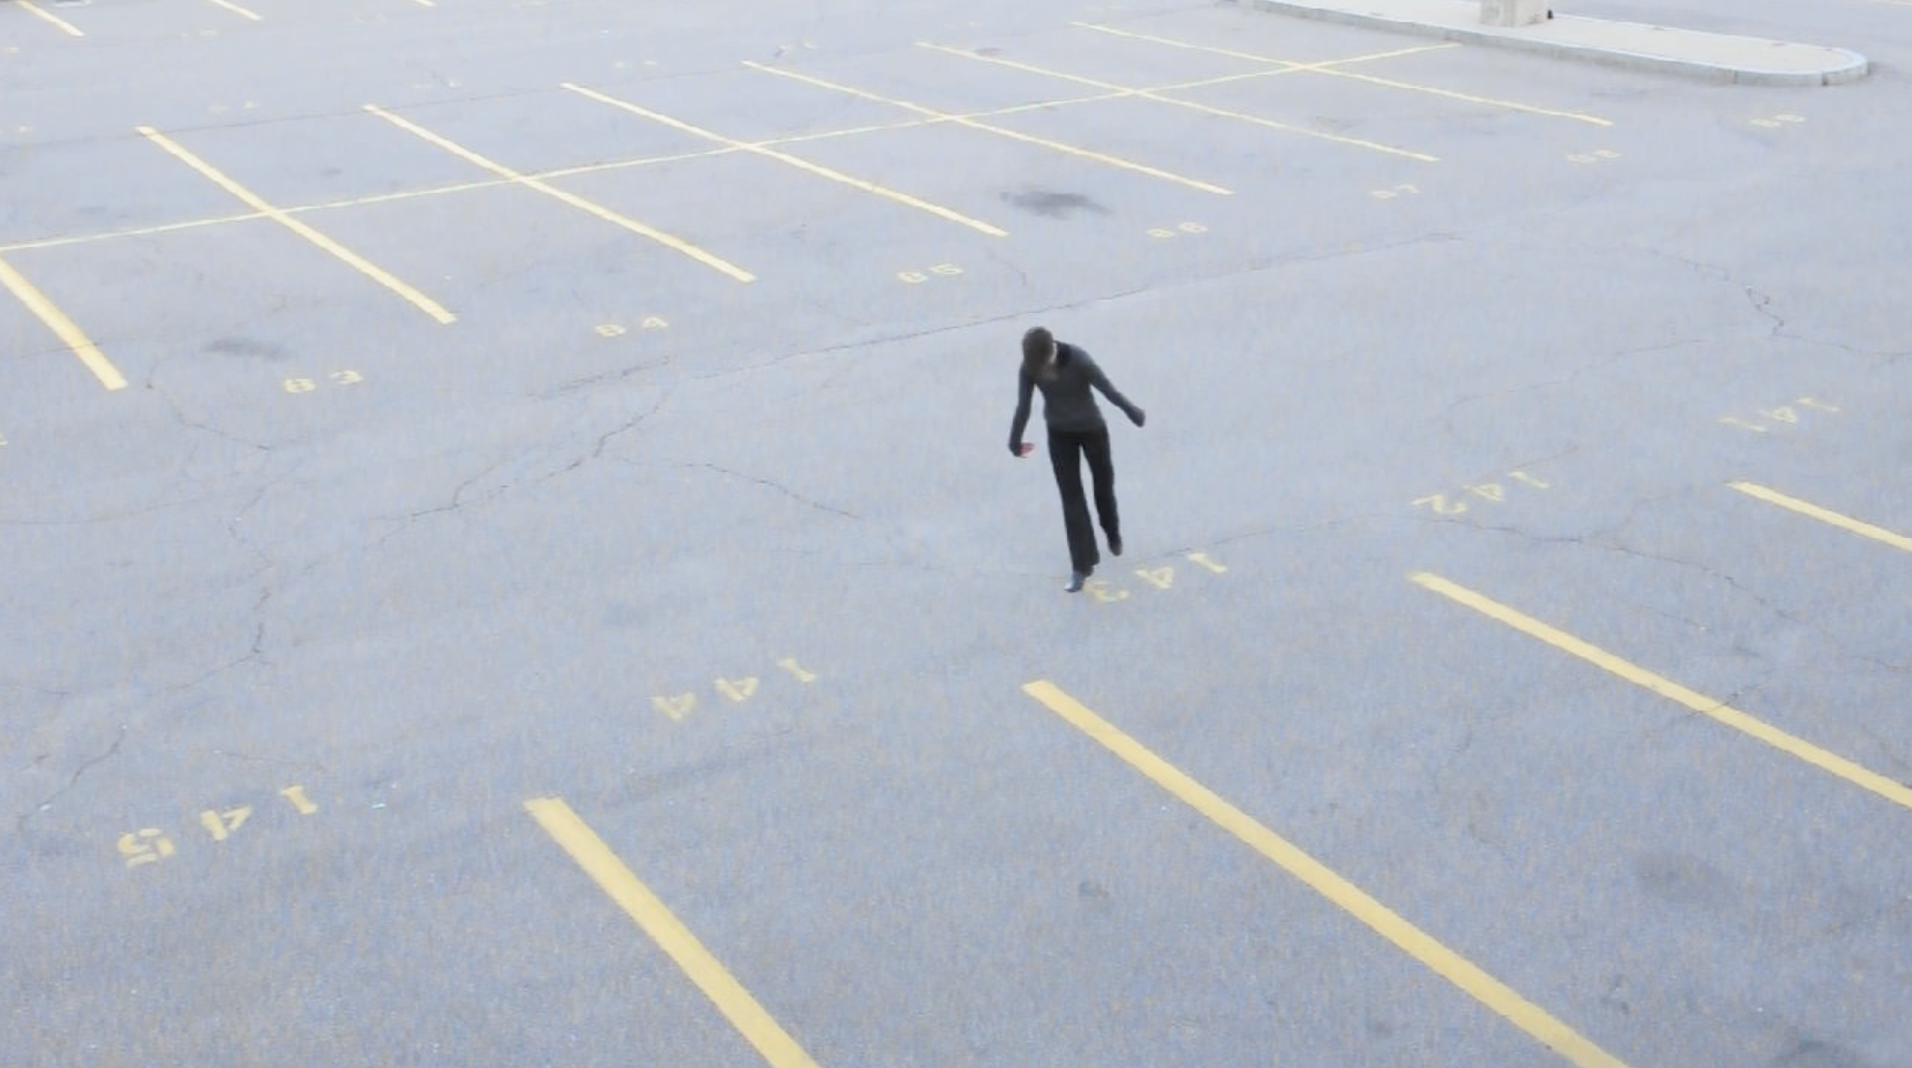
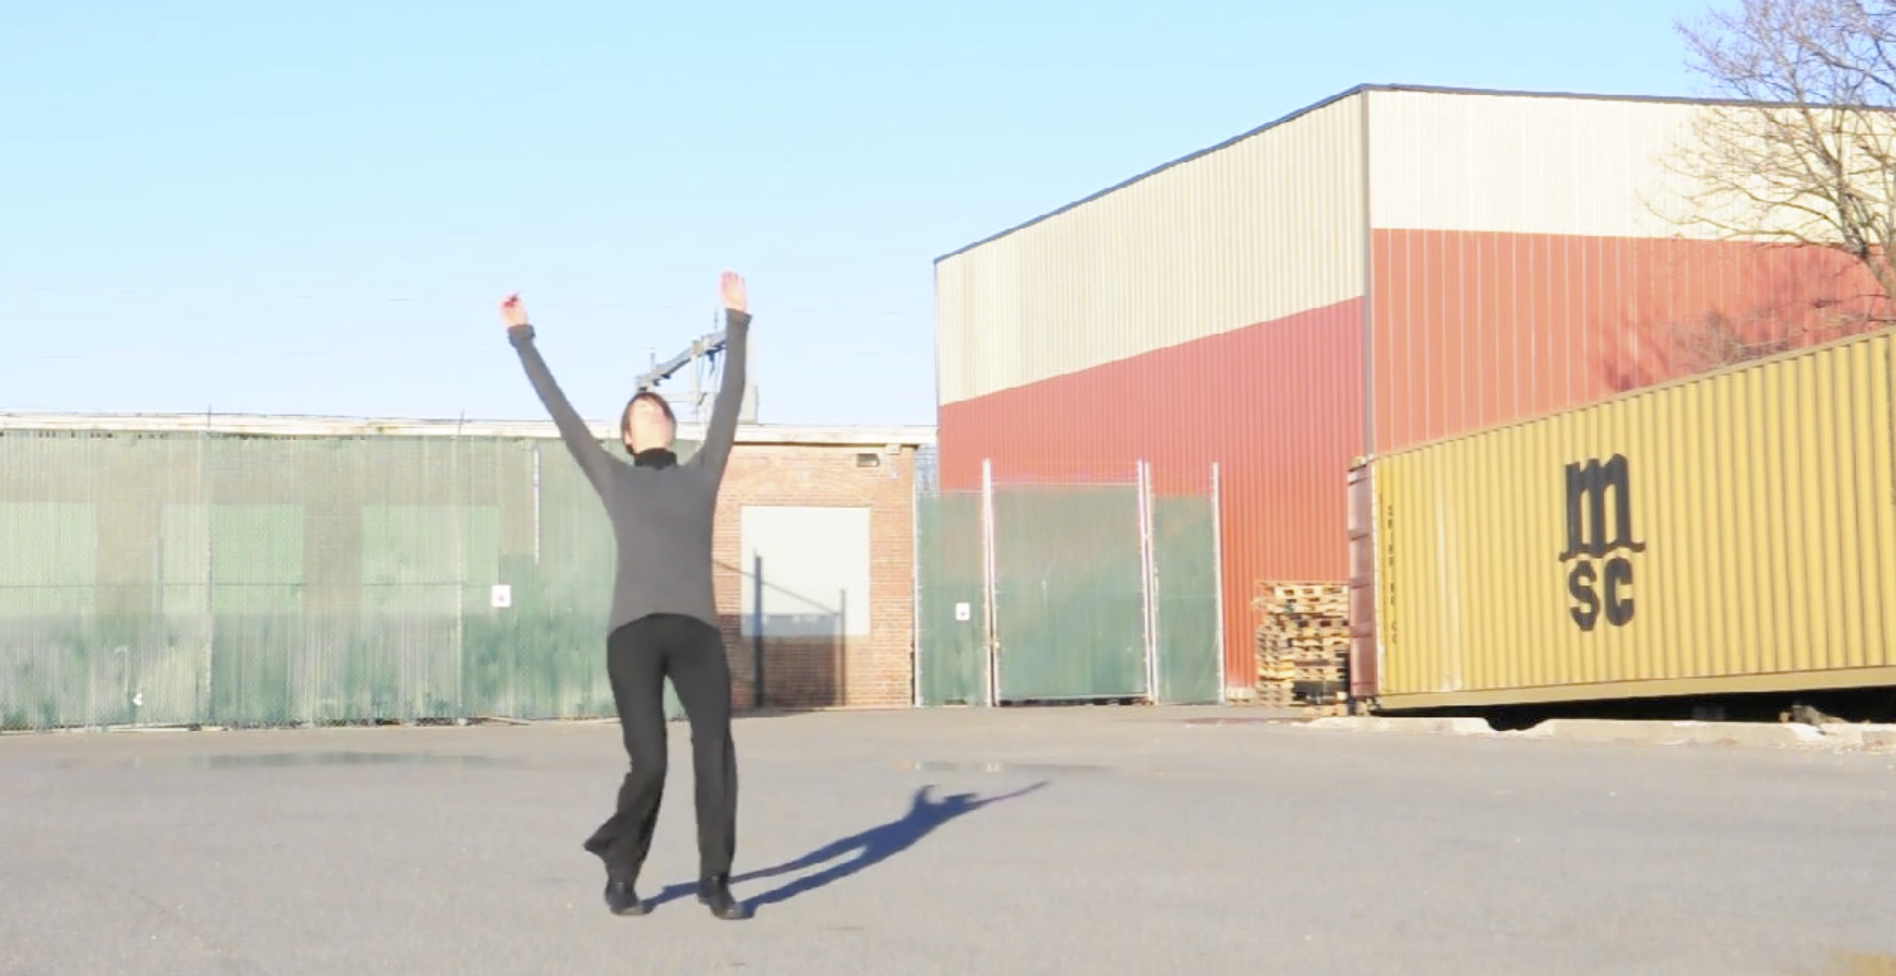
If Wind Now, 2013 4 min video Dancer: Sarah Baumert A dancer performs the wind scores in exurban spaces Click the image to view the video on Vimeo

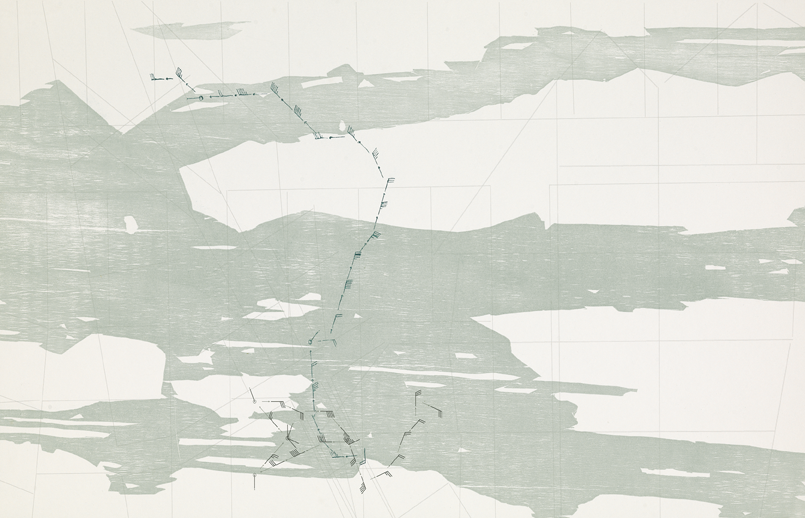
A Year Of Wind, 2011, 102 x 457,5 cm, digital print, edition of 3 A year of wind gathers together a year of wind data from Concord in 2010. Accumulating hour by hour, there are 8760 wind barbs or steps that trace a series of paths across the triptych.